Annual Drinking Water Quality ReportTX0310008 |
TOWN OF INDIAN LAKE |
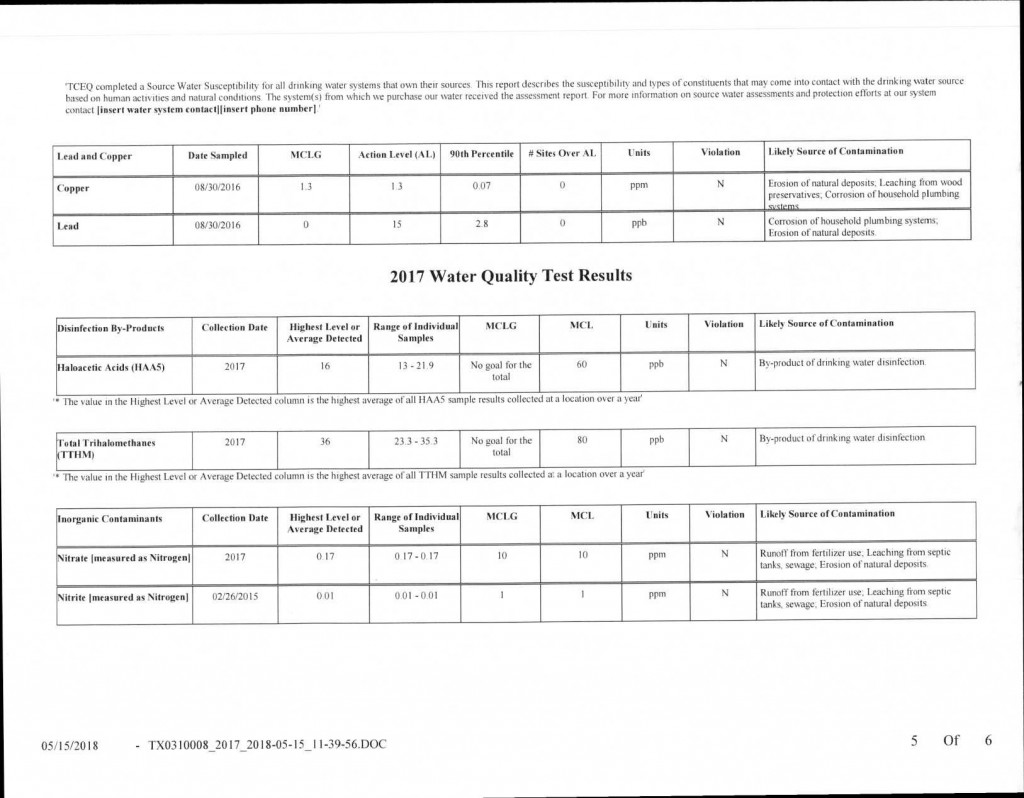
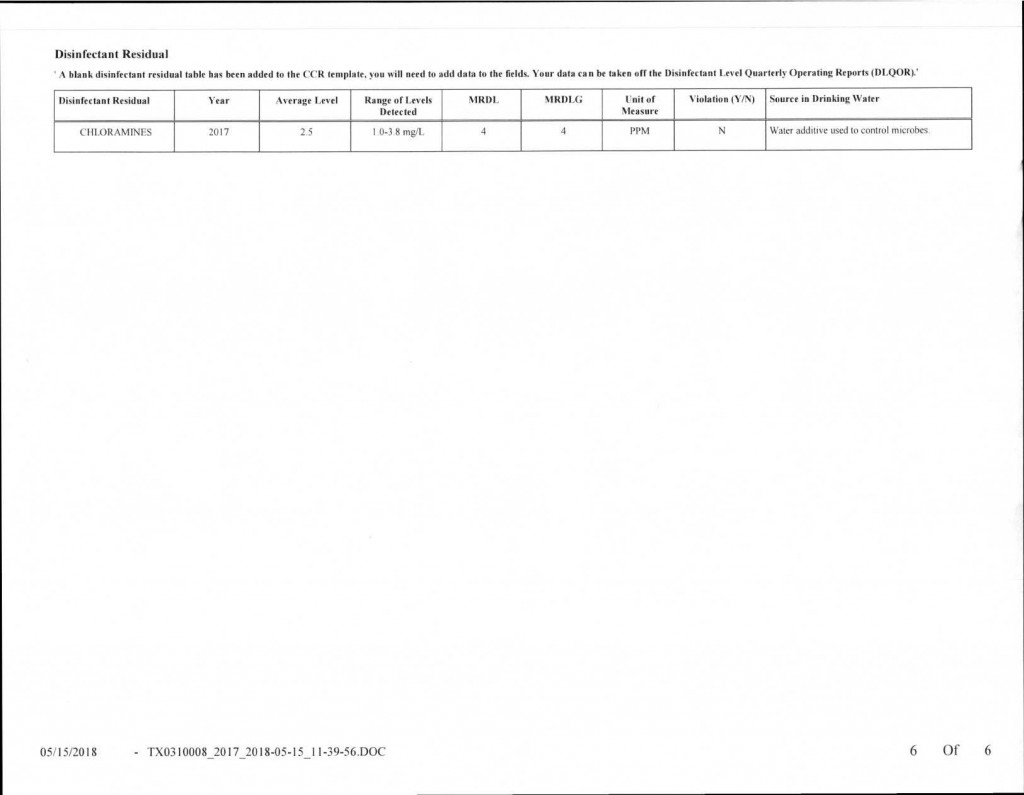
2017 Annual Drinking Water Quality Report
2016 Annual Drinking Water Quality Report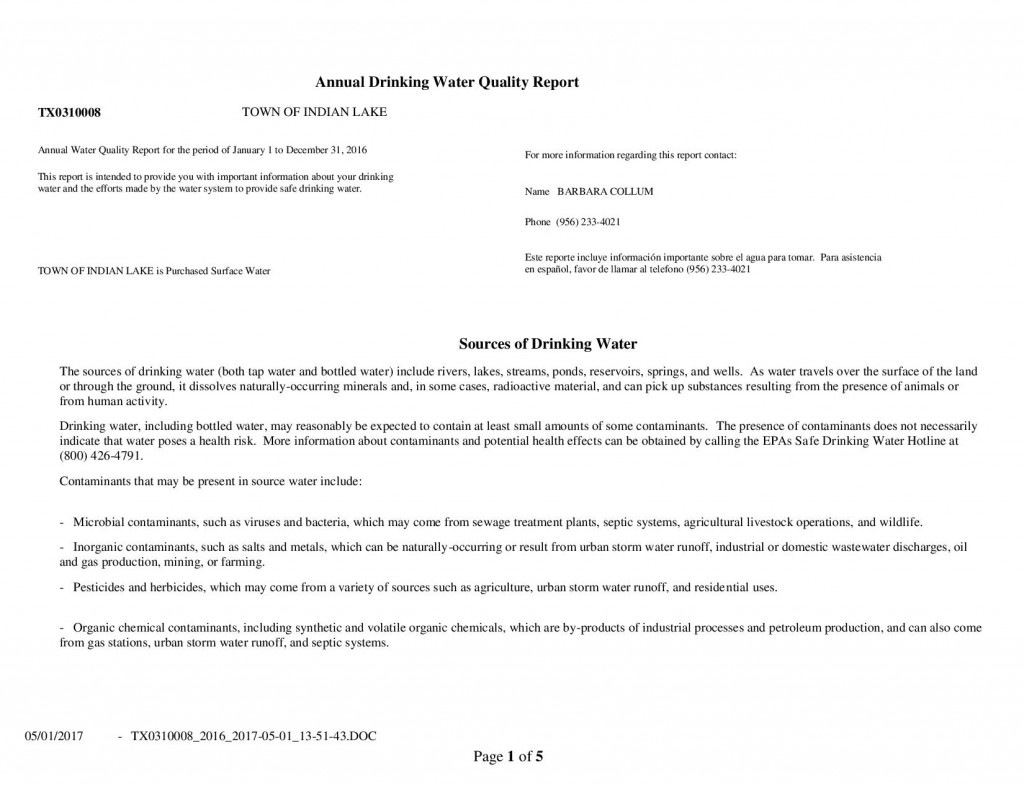
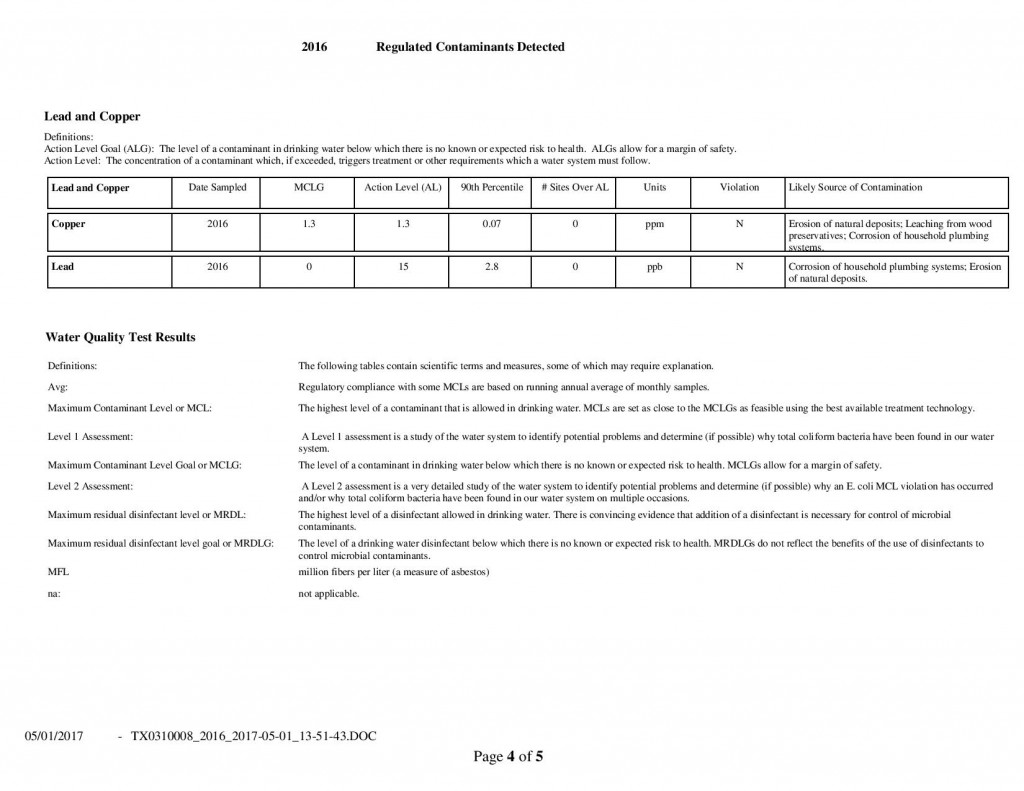
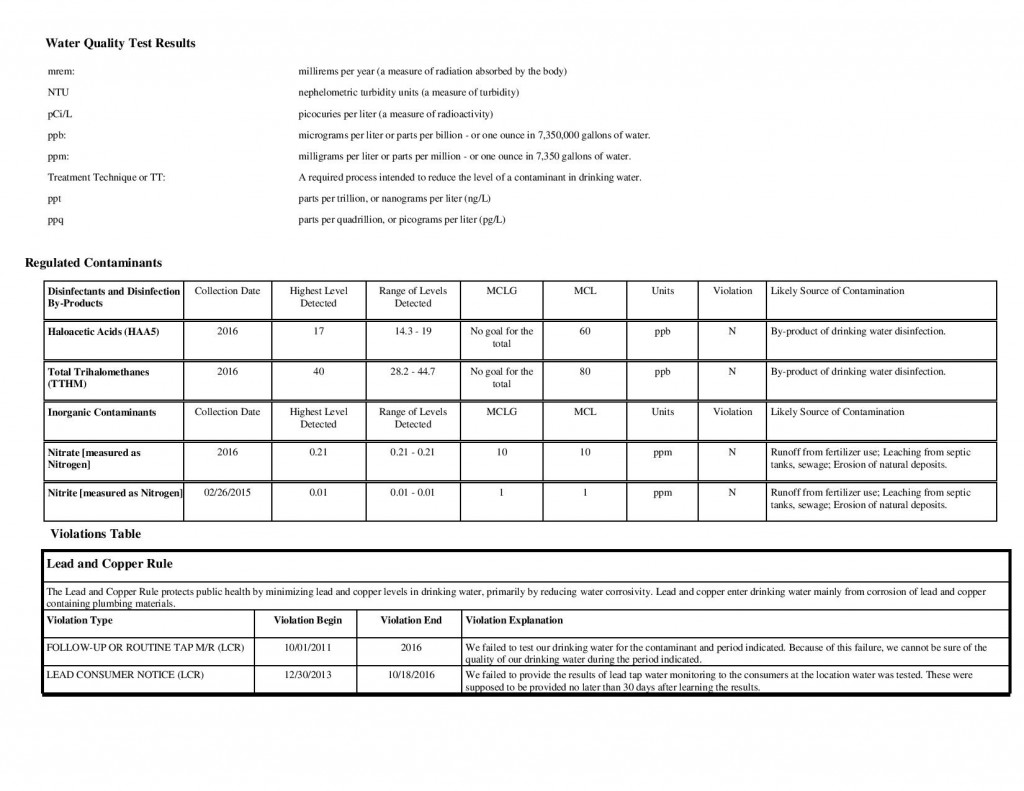
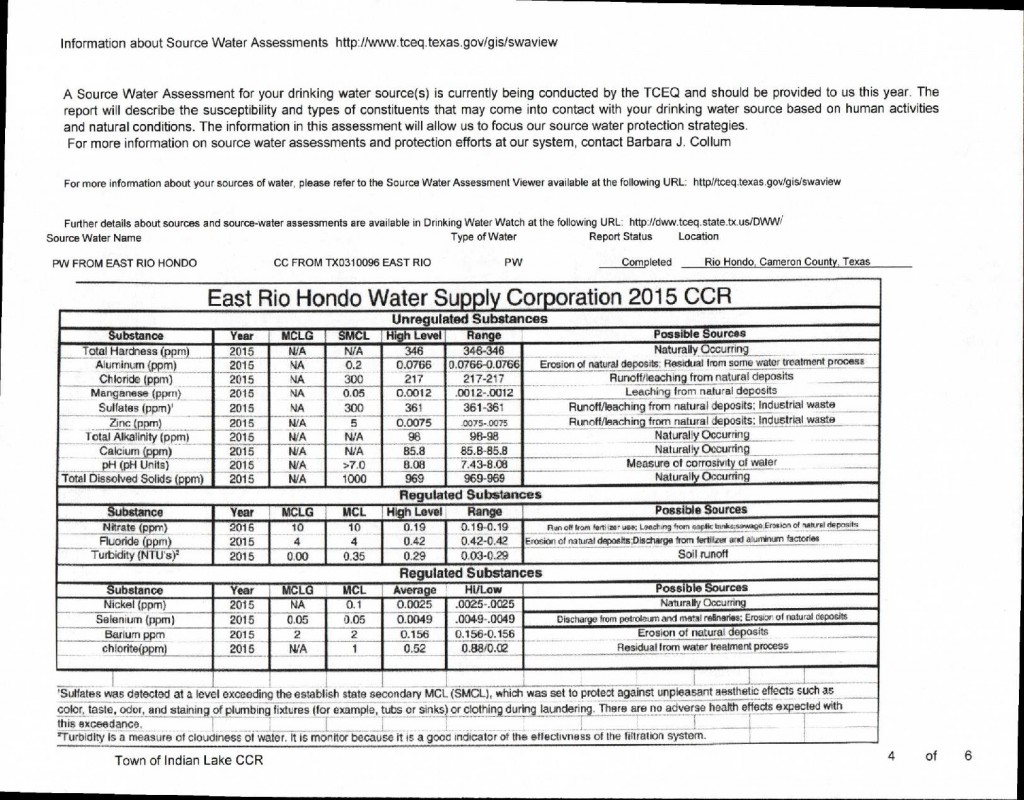
2015 Annual Drinking Water Quality Report
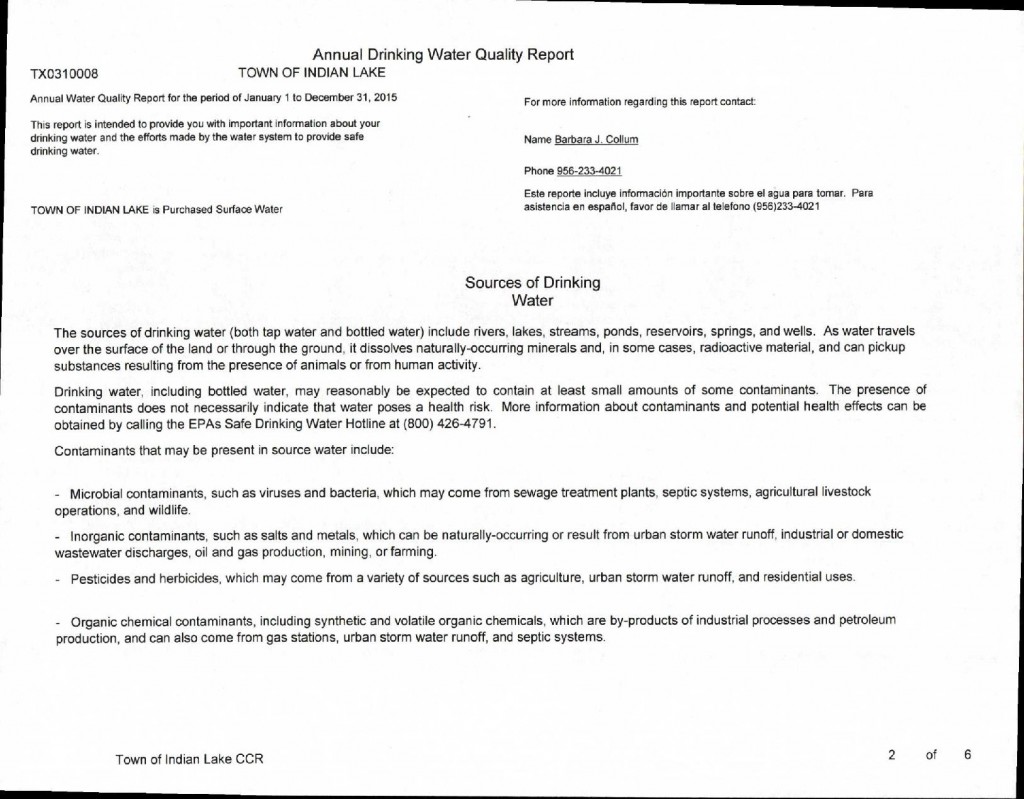
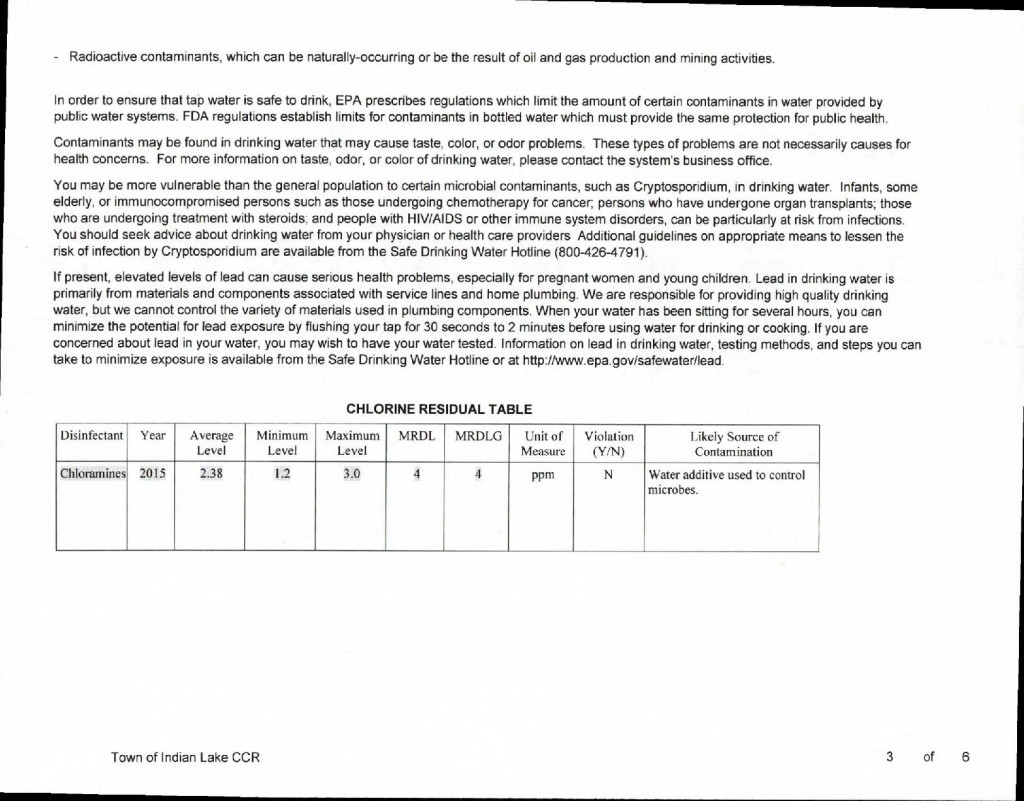
2014 Annual Drinking Water Quality Report
2014 Annual Drinking Water Quality Report
2013
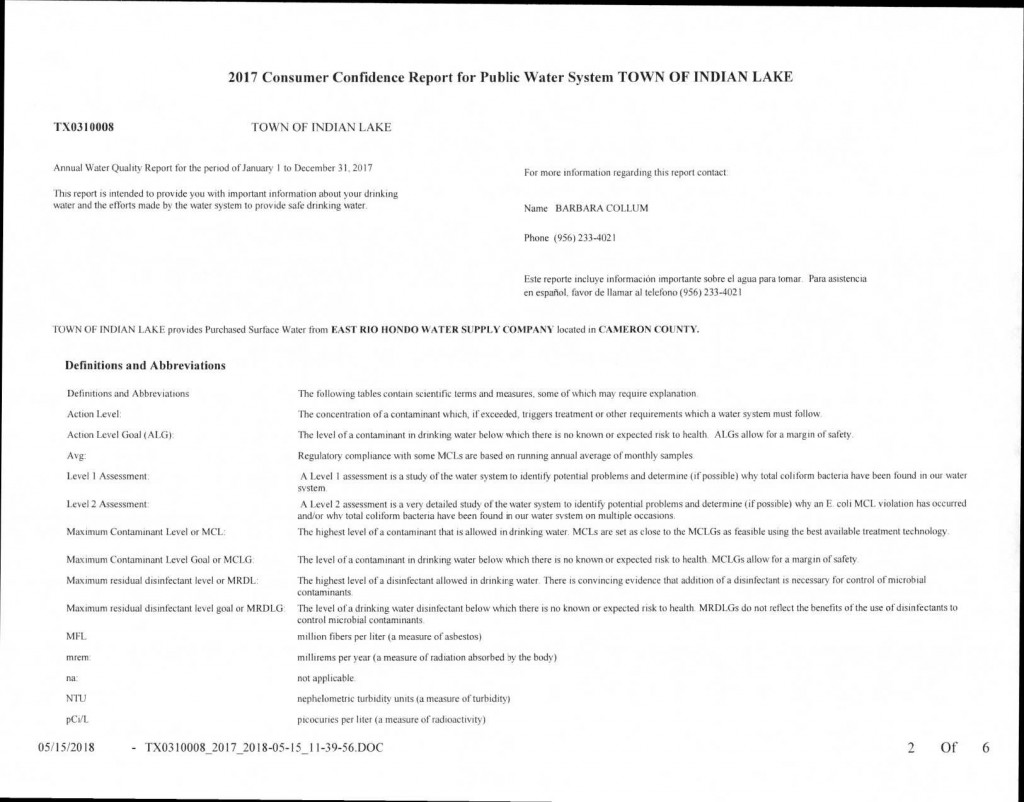
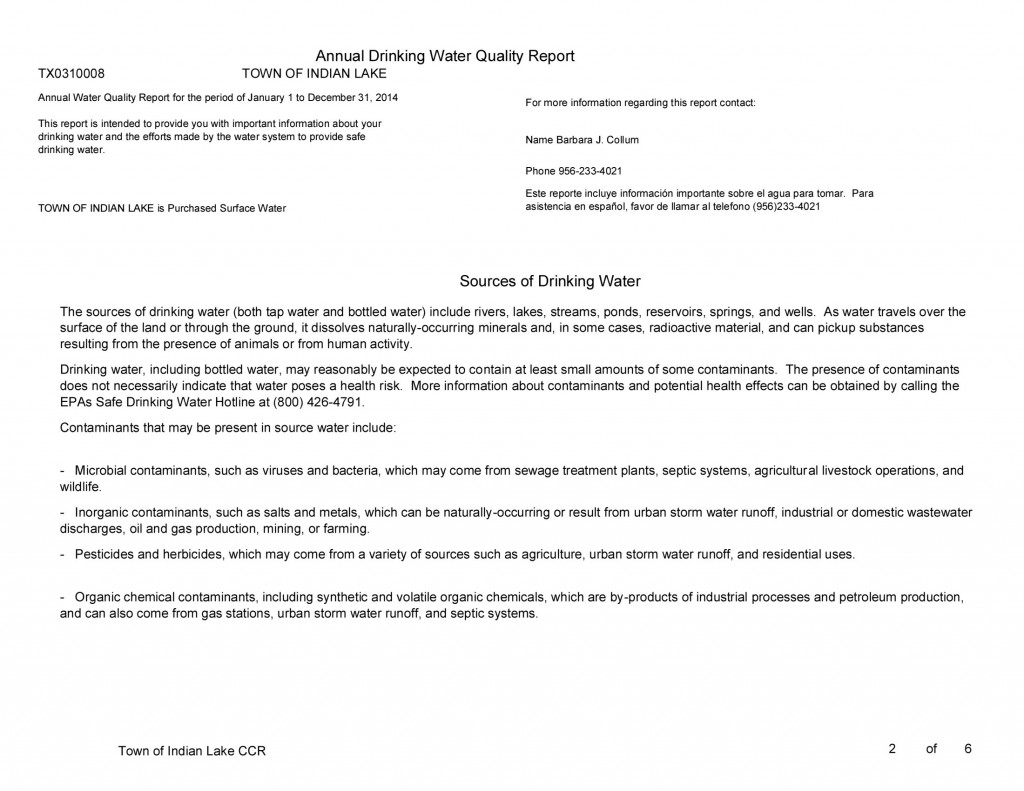
| Annual Water Quality Report for the period of January 1 to December 31, 2013 | ||
| For more information regarding this report contact: | ||
| This report is intended to provide you with important information about your drinking water and the efforts made by the water system to provide safe drinking water. | ||
| Name Barbara Collum, Mayor | ||
| Phone (956) 233-4021 | ||
| Este reporte incluye información importante sobre el agua para tomar. Para asistencia en español, favor de llamar al telefono (956) 233-4021. | ||
| TOWN OF INDIAN LAKE is Purchased Surface Water | ||
Sources of Drinking Water
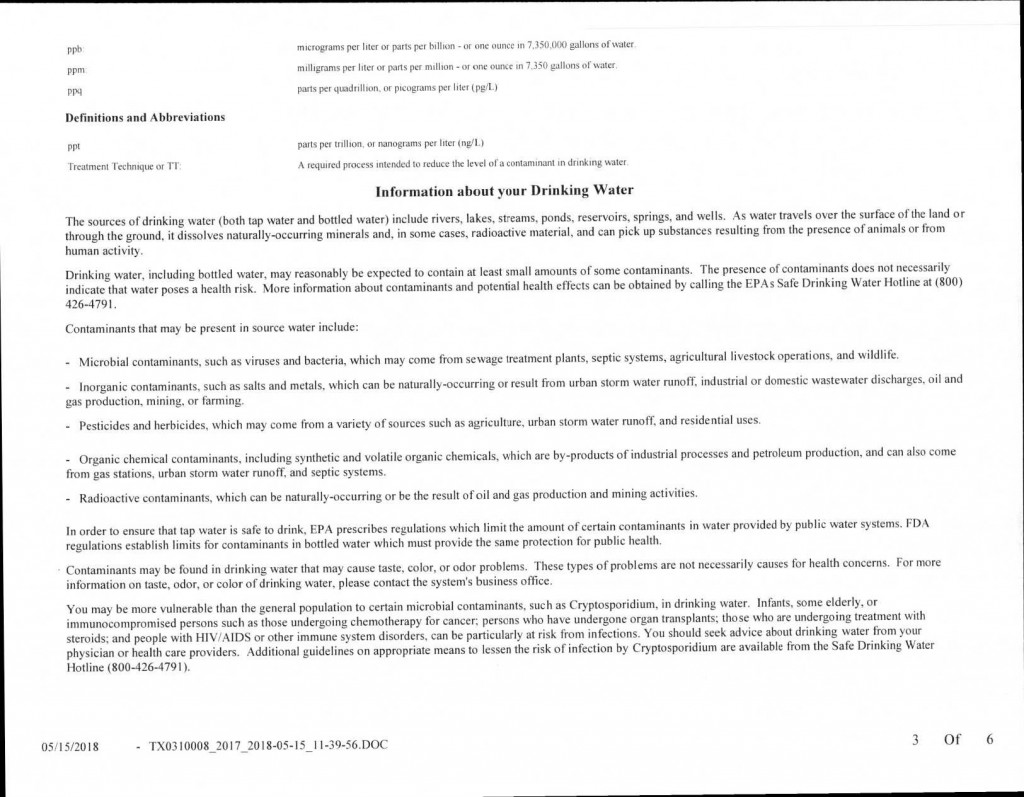
The sources of drinking water (both tap water and bottled water) include rivers, lakes, streams, ponds, reservoirs, springs, and wells. As water travels over the surface of the land or through the ground, it dissolves naturally-occurring minerals and, in some cases, radioactive material, and can pickup substances resulting from the presence of animals or from human activity.
Drinking water, including bottled water, may reasonably be expected to contain at least small amounts of some contaminants. The presence of contaminants does not necessarily indicate that water poses a health risk. More information about contaminants and potential health effects can be obtained by calling the EPAs Safe Drinking Water Hotline at (800) 426-4791.
Contaminants that may be present in source water include:
– Microbial contaminants, such as viruses and bacteria, which may come from sewage treatment plants, septic systems, agricultural livestock operations, and wildlife.
– Inorganic contaminants, such as salts and metals, which can be naturally-occurring or result from urban storm water runoff, industrial or domestic wastewater discharges, oil and gas production, mining, or farming.
– Pesticides and herbicides, which may come from a variety of sources such as agriculture, urban storm water runoff, and residential uses.
– Organic chemical contaminants, including synthetic and volatile organic chemicals, which are by-products of industrial processes and petroleum production, and can also come from gas stations, urban storm water runoff, and septic systems.
– Radioactive contaminants, which can be naturally-occurring or be the result of oil and gas production and mining activities.
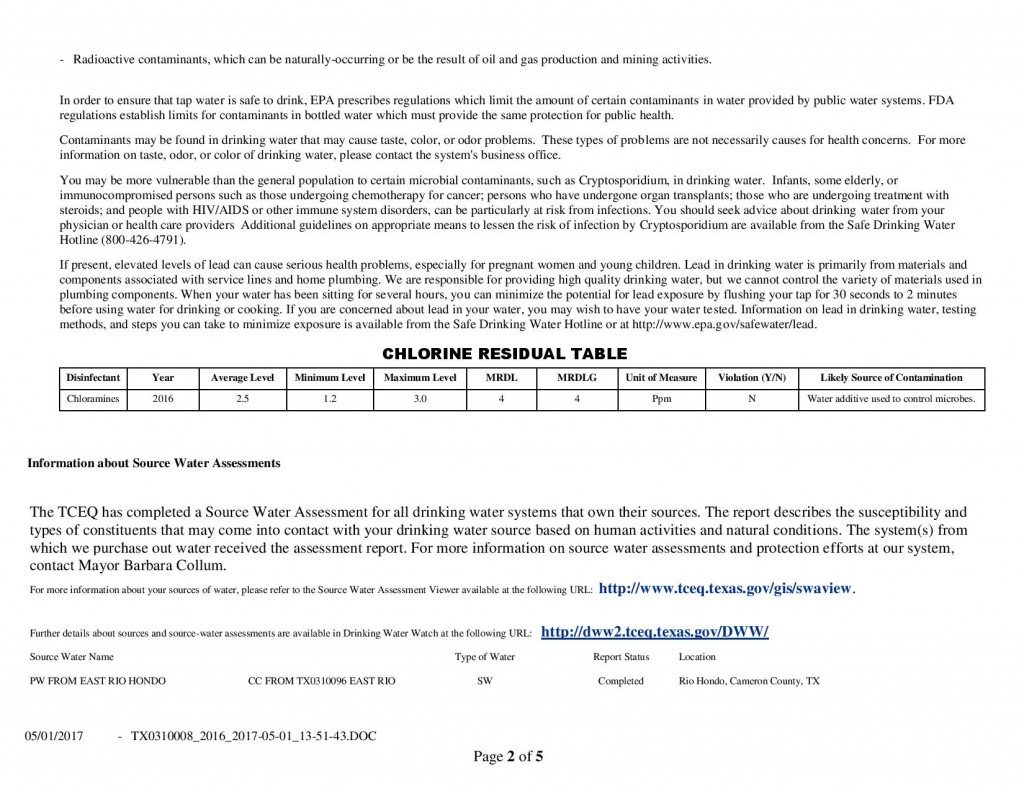
In order to ensure that tap water is safe to drink, EPA prescribes regulations which limit the amount of certain contaminants in water provided by public water systems. FDA regulations establish limits for contaminants in bottled water which must provide the same protection for public health.
Contaminants may be found in drinking water that may cause taste, color, or odor problems. These types of problems are not necessarily causes for health concerns. For more information on taste, odor, or color of drinking water, please contact the system’s business office.
You may be more vulnerable than the general population to certain microbial contaminants, such as Cryptosporidium, in drinking water. Infants, some elderly, or immunocompromised persons such as those undergoing chemotherapy for cancer; persons who have undergone organ transplants; those who are undergoing treatment with steroids; and people with HIV/AIDS or other immune system disorders, can be particularly at risk from infections. You should seek advice about drinking water from your physician or health care providers Additional guidelines on appropriate means to lessen the risk of infection by Cryptosporidium are available from the Safe Drinking Water Hotline (800-426-4791).
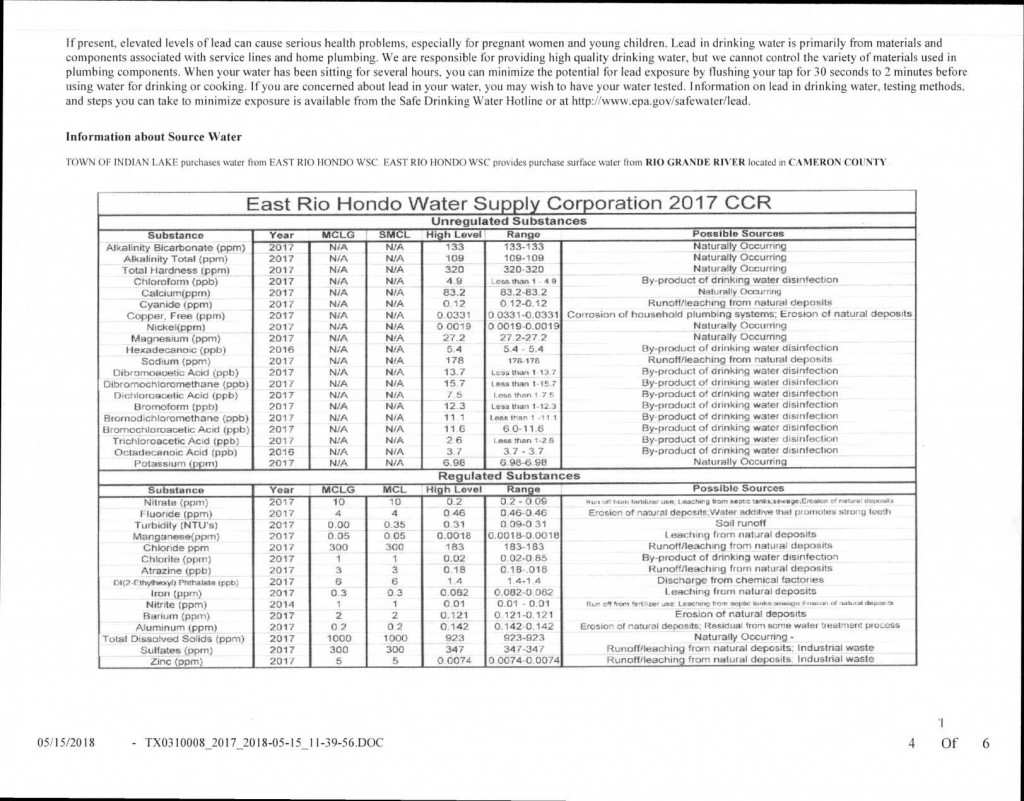
If present, elevated levels of lead can cause serious health problems, especially for pregnant women and young children. Lead in drinking water is primarily from materials and components associated with service lines and home plumbing. We are responsible for providing high quality drinking water, but we cannot control the variety of materials used in plumbing components. When your water has been sitting for several hours, you can minimize the potential for lead exposure by flushing your tap for 30 seconds to 2 minutes before using water for drinking or cooking. If you are concerned about lead in your water, you may wish to have your water tested. Information on lead in drinking water, testing methods, and steps you can take to minimize exposure is available from the Safe Drinking Water Hotline or at http://www.epa.gov/safewater/lead.
Information about Source Water Assessments
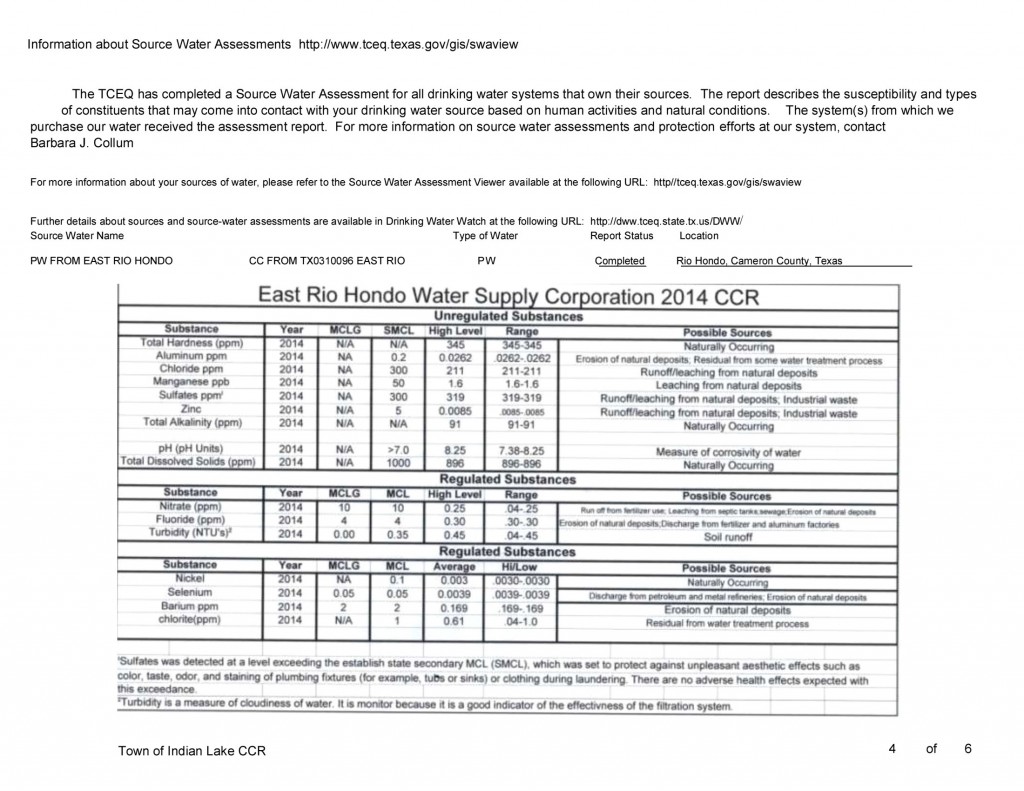
The TCEQ has completed a Source Water Assessment for all drinking water systems that own their sources. The report describes the susceptibility and types of constituents that may come into contact with your drinking water source based on human activities and natural conditions. The system(s) from which we purchase our water received the assessment report. For more information on source water assesments and protection efforts at our system, contact Mayor Barbara Collum.
For more information about your sources of water, please refer to the Source Water Assessment Viewer available at the following URL: http://www.tceq.texas.gov/gis/swaview
Further details about sources and source-water assessments are available in Drinking Water Watch at the following URL: http://dww.tceq.state.tx.us/DWW/
| Source Water Name |
Type of Water |
Report Status |
Location | |
| PW FROM EAST RIO HONDO | CC FROM TX0310096 EAST RIO |
SW |
Completed |
Rio Hondo, Cameron County, Texas |
| 2013 | Regulated Contaminants Detected |
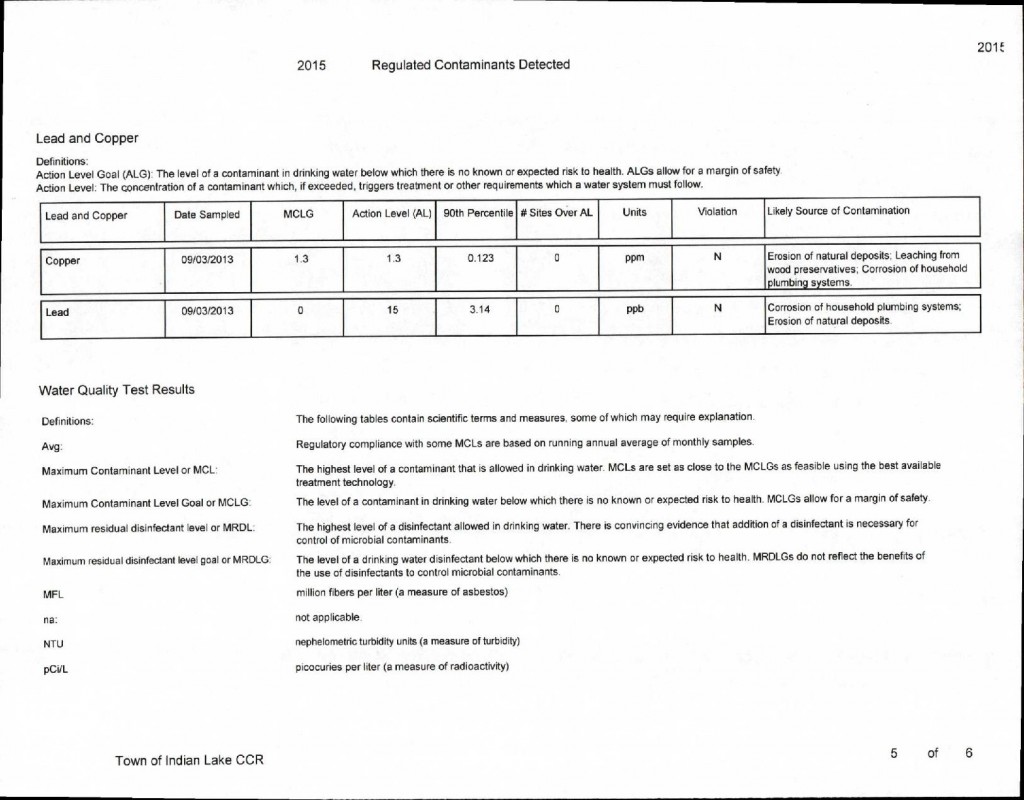
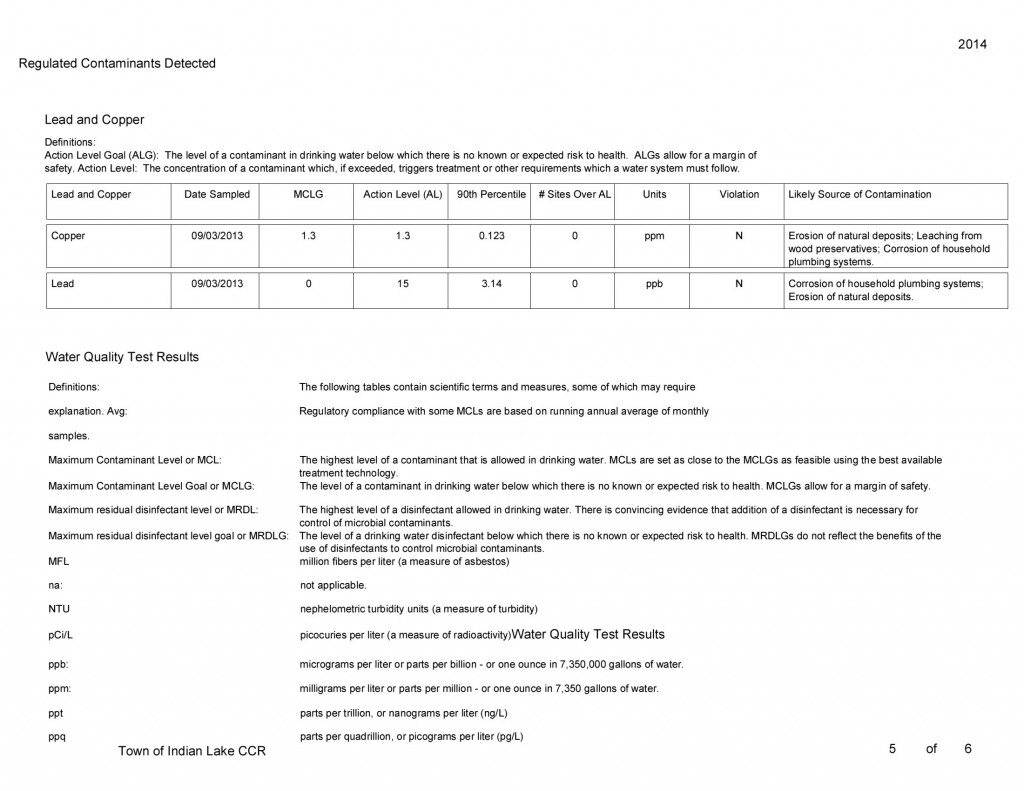
Lead and Copper
Definitions:
Action Level Goal (ALG): The level of a contaminant in drinking water below which there is no known or expected risk to health. ALGs allow for a margin of safety.
Action Level: The concentration of a contaminant which, if exceeded, triggers treatment or other requirements which a water system must follow.
| Lead and Copper |
Date Sampled |
MCLG |
Action Level (AL) |
90th Percentile |
# Sites Over AL |
Units |
Violation |
Likely Source of Contamination |
| Copper |
2013 |
1.3 |
1.3 |
0.123 |
0 |
ppm |
N |
Erosion of natural deposits; Leaching from wood preservatives; Corrosion of household plumbing systems. |
| Lead |
2013 |
0 |
15 |
3.14 |
0 |
ppb |
N |
Corrosion of household plumbing systems; Erosion of natural deposits. |
Water Quality Test Results
| Definitions: | The following tables contain scientific terms and measures, some of which may require explanation. | |
| Avg: | Regulatory compliance with some MCLs are based on running annual average of monthly samples. | |
| Maximum Contaminant Level or MCL: | The highest level of a contaminant that is allowed in drinking water. MCLs are set as close to the MCLGs as feasible using the best available treatment technology. | |
| Maximum Contaminant Level Goal or MCLG: | The level of a contaminant in drinking water below which there is no known or expected risk to health. MCLGs allow for a margin of safety. | |
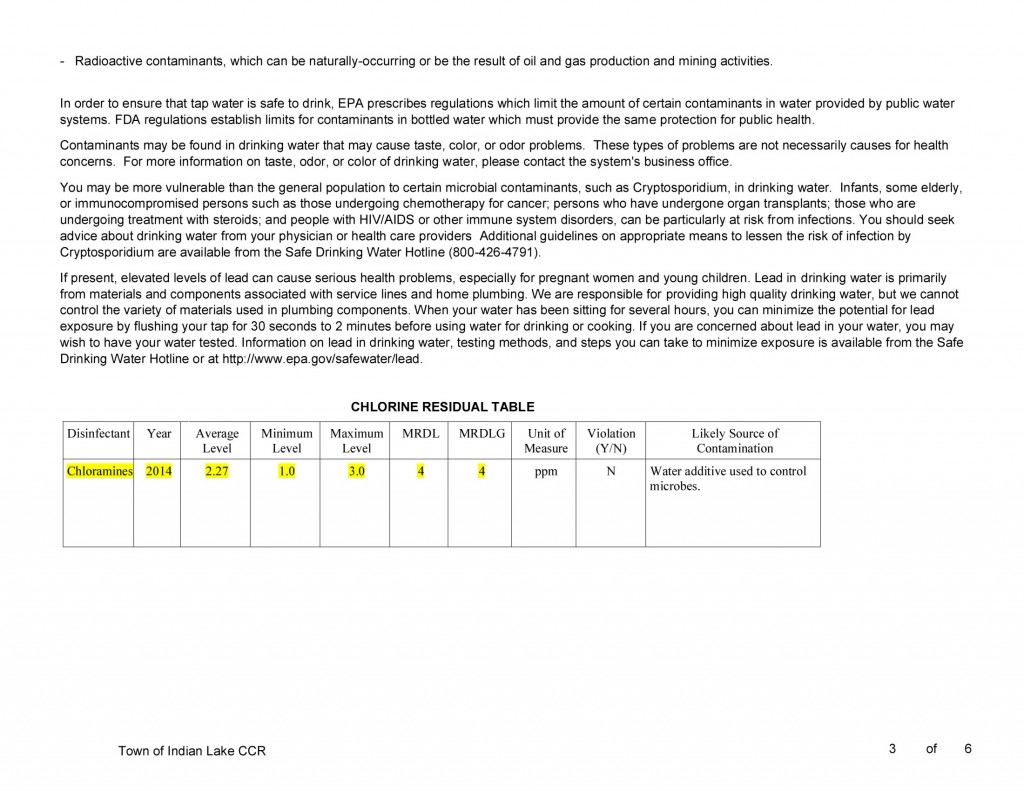
| Maximum residual disinfectant level or MRDL: | The highest level of a disinfectant allowed in drinking water. There is convincing evidence that addition of a disinfectant is necessary for control of microbial contaminants. | |
| Maximum residual disinfectant level goal or MRDLG: | The level of a drinking water disinfectant below which there is no known or expected risk to health. MRDLGs do not reflect the benefits of the use of disinfectants to control microbial contaminants. | |
| MFL | million fibers per liter (a measure of asbestos) | |
| na: | not applicable. | |
| NTU | nephelometric turbidity units (a measure of turbidity) | |
| pCi/L | picocuries per liter (a measure of radioactivity) |
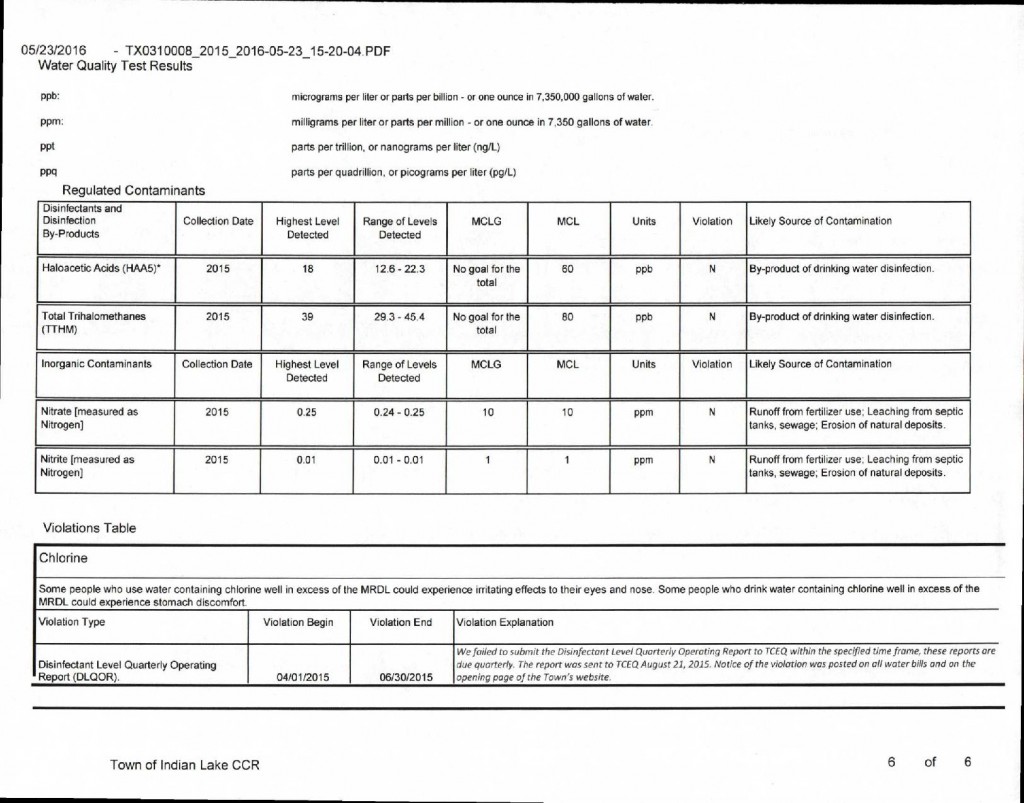
Water Quality Test Results
| ppb: | micrograms per liter or parts per billion – or one ounce in 7,350,000 gallons of water. | |
| ppm: | milligrams per liter or parts per million – or one ounce in 7,350 gallons of water. | |
| ppt | parts per trillion, or nanograms per liter (ng/L) | |
| ppq | parts per quadrillion, or picograms per liter (pg/L) |
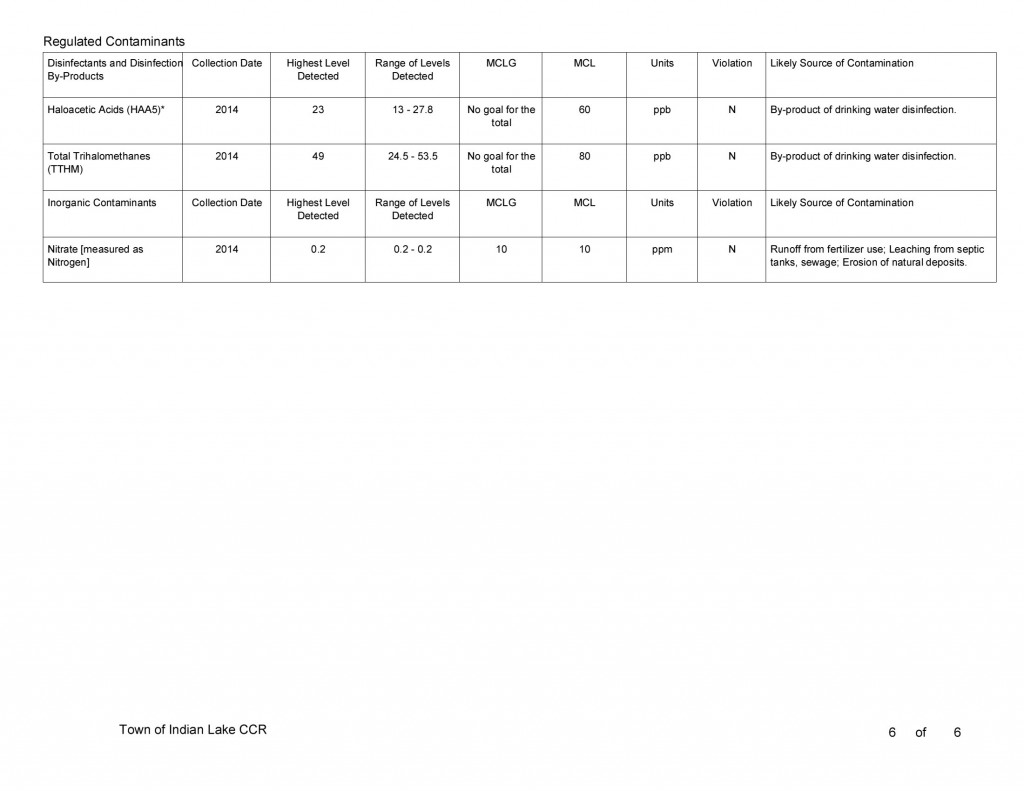
Regulated Contaminants
| Disinfectants and Disinfection By-Products |
Collection Date |
Highest Level Detected |
Range of Levels Detected |
MCLG |
MCL |
Units |
Violation |
Likely Source of Contamination |
| Haloacetic Acids (HAA5)* |
2013 |
22 |
12.8 – 27.1 |
No goal for the total |
60 |
ppb |
N |
By-product of drinking water disinfection. |
| Total Trihalomethanes (TTHM) |
2013 |
39 |
15.3 – 59.4 |
No goal for the total |
80 |
ppb |
N |
By-product of drinking water disinfection. |
| Inorganic Contaminants |
Collection Date |
Highest Level Detected |
Range of Levels Detected |
MCLG |
MCL |
Units |
Violation |
Likely Source of Contamination |
| Nitrate [measured as Nitrogen] |
2013 |
0.24 |
0.24 – 0.24 |
10 |
10 |
ppm |
N |
Runoff from fertilizer use; Leaching from septic tanks, sewage; Erosion of natural deposits. |
Violations Table
| Chlorine | ||||
| Some people who use water containing chlorine well in excess of the MRDL could experience irritating effects to their eyes and nose. Some people who drink water containing chlorine well in excess of the MRDL could experience stomach discomfort. | ||||
| Violation Type |
Violation Begin |
Violation End |
Violation Explanation | |
| Disinfectant Level Quarterly Operating Report (DLQOR). |
07/01/2013 |
09/30/2013 |
The Report was mailed but not received at the TCEQ office. After notification the report was then faxed to the office and the Town of Indian Lake is now is compliance. | |
| Disinfectant Level Quarterly Operating Report (DLQOR). |
10/01/2013 |
12/31/2013 |
The Report was mailed but not received at the TCEQ office. After notification the report was then faxed to the office and the Town of Indian Lake is now is compliance. | |
| Lead and Copper Rule | ||||
| The Lead and Copper Rule protects public health by minimizing lead and copper levels in drinking water, primarily by reducing water corrosivity. Lead and copper enter drinking water mainly from corrosion of lead and copper containing plumbing materials. | ||||
| Violation Type |
Violation Begin |
Violation End |
Violation Explanation | |
| FOLLOW-UP OR ROUTINE TAP M/R (LCR) |
10/01/2011 |
2013 |
We failed to test our drinking water for the contaminant and period indicated. Because of this failure, we cannot be sure of the quality of our drinking water during the period indicated. | |
| LEAD CONSUMER NOTICE (LCR) |
12/30/2013 |
2013 |
We failed to provide the results of lead tap water monitoring to the consumers at the location water was tested. These were supposed to be provided no later than 30 days after learning the results. | |
Town of Indian Lake, Tx. incorporated in 1978.
Idyllic resort-like environment – touch and go to numerous amazing locales it is surrounded by, s eems like a vacation every day!
Has a serene and quiet quality of life; a safe and secure family environment. It’s located in a rural setting for those who enjoy the outdoors and it’s an ideal place for bird-watching. Birds as well as butterflies migrate yearly through this area. Especially attractive and enjoyable are the Indian Lake Waterways and Cuates Resaca (one of the many fresh water tributaries off of the historic Rio Grande River). A mixture of modular and small brick homes exist here. Best school board and one of the best school districts in the lower Rio GrandeValley area. The Town of Indian Lake, Tx. is also a pleasant as well as affordable locality for visiting Winter Texans.
The Town of Indian Lake, Tx. is centrally located –
It is situated by Los Fresnos, Tx. and south of San Benito and Harlingen, Tx.
To the south 9 miles is Brownsville; also south 12 miles is the Mexican Border. To the north approximately 22 miles lies Arroyo City – a fishing resort that is by an estuary called the Arroyo Colorado. To the east 21 miles, lies South Padre Island, another famous resort, site of fishing, numerous water activities in it’s bay as well as beach activities and rides and numerous forms of indoor and outdoor entertainment venues.
